Gaps in Seattle’s streets
Earlier this year I created a project identifying gaps in Seattle’s street network. Briefly, I used a combination of NetworkX, GeoPandas, and other python libraries to find instances of discontinuous streets. Effectively, streets that run for a few blocks, terminate, and then resume. I found over 1.3K roads that exhibit this behavior within the City of Seattle. I produced statistics about the existing and added streets, but one statistic that I was asked about several times was which streets featured more added length than existing length. Accordingly, I spent a little time identifying the streets with more added within-sector road miles than existing within-sector road miles for each of the city’s eight sectors.
Recall that Seattle is divided into eight sectors, based on compass directions. The eight sectors can be seen in the image below.
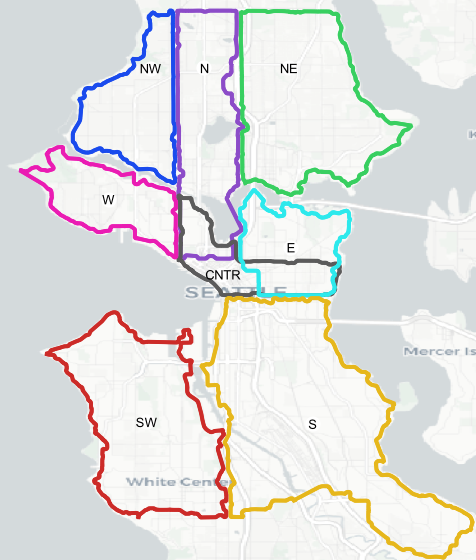
These sectors were created by grouping the directional prefix and suffix of the streets in the Seattle street network. From there, a concave hull was created to go from point cloud to polygon. See this page for code illustrating how I created the convex hull and concave hulls. In general, the sectors feature clear distinctions, except for the North, Center, and East Sectors. The Center sector is named for roads without a directional prefix. In the central business district of Seattle, both streets and avenues are directionless. North of Denny way, streets are directionless while avenues are not. East of Broadway, streets feature a direction while avenues do not. As such, the Center sector overlaps with both the North and the East sector. I used these sectors to frame each subsequent step in this analysis.
Ratio of existing road miles to added road miles.
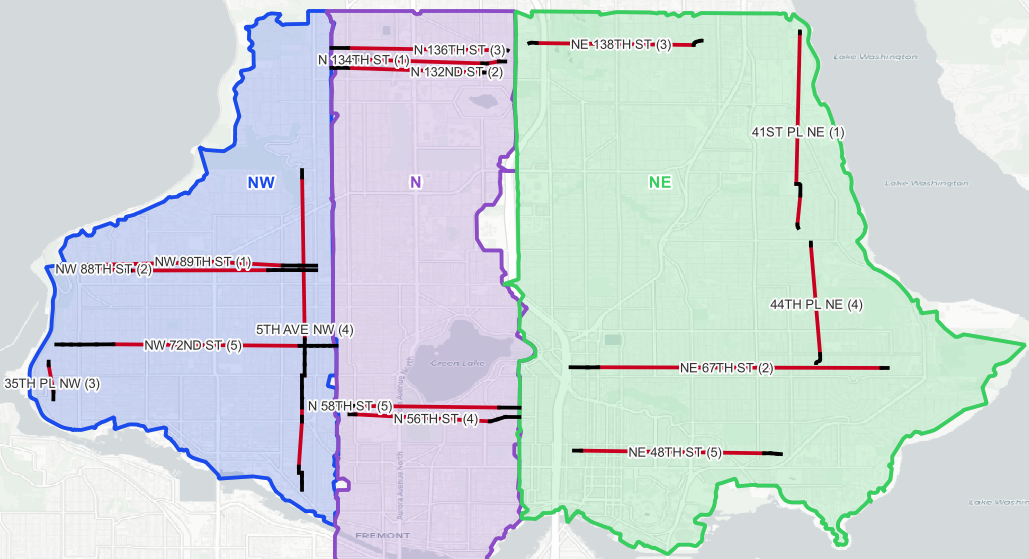
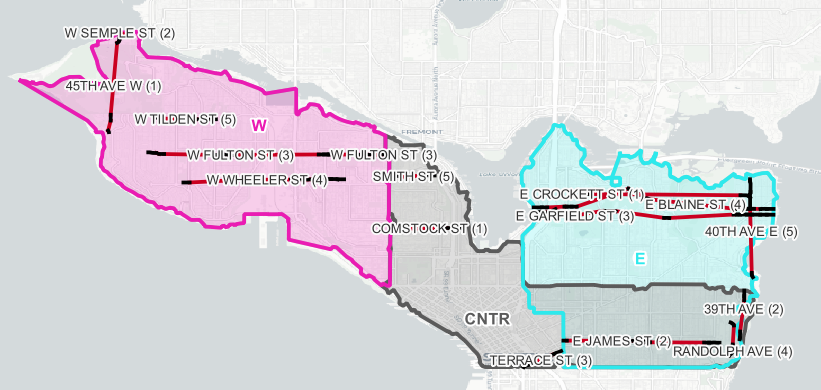
For each street in each sector, I computed the ratio of existing road miles to added road miles. The existing road miles are the actual roads and the added road miles the “gaps” between existing portions of roads. In this map, the existing roads are black and the missing “gaps” are red. A value of existing road miles to added road miles greater than 1.0 indicates that for a given street, there are more existing road miles than added road miles. Effectively, this means that the gaps between existing road segments are small. A value of existing road miles to added road miles less than 1.0 indicates that there are more added road miles than existing road miles.
The image below features the ratio of existing to added streets plotted by city sector.
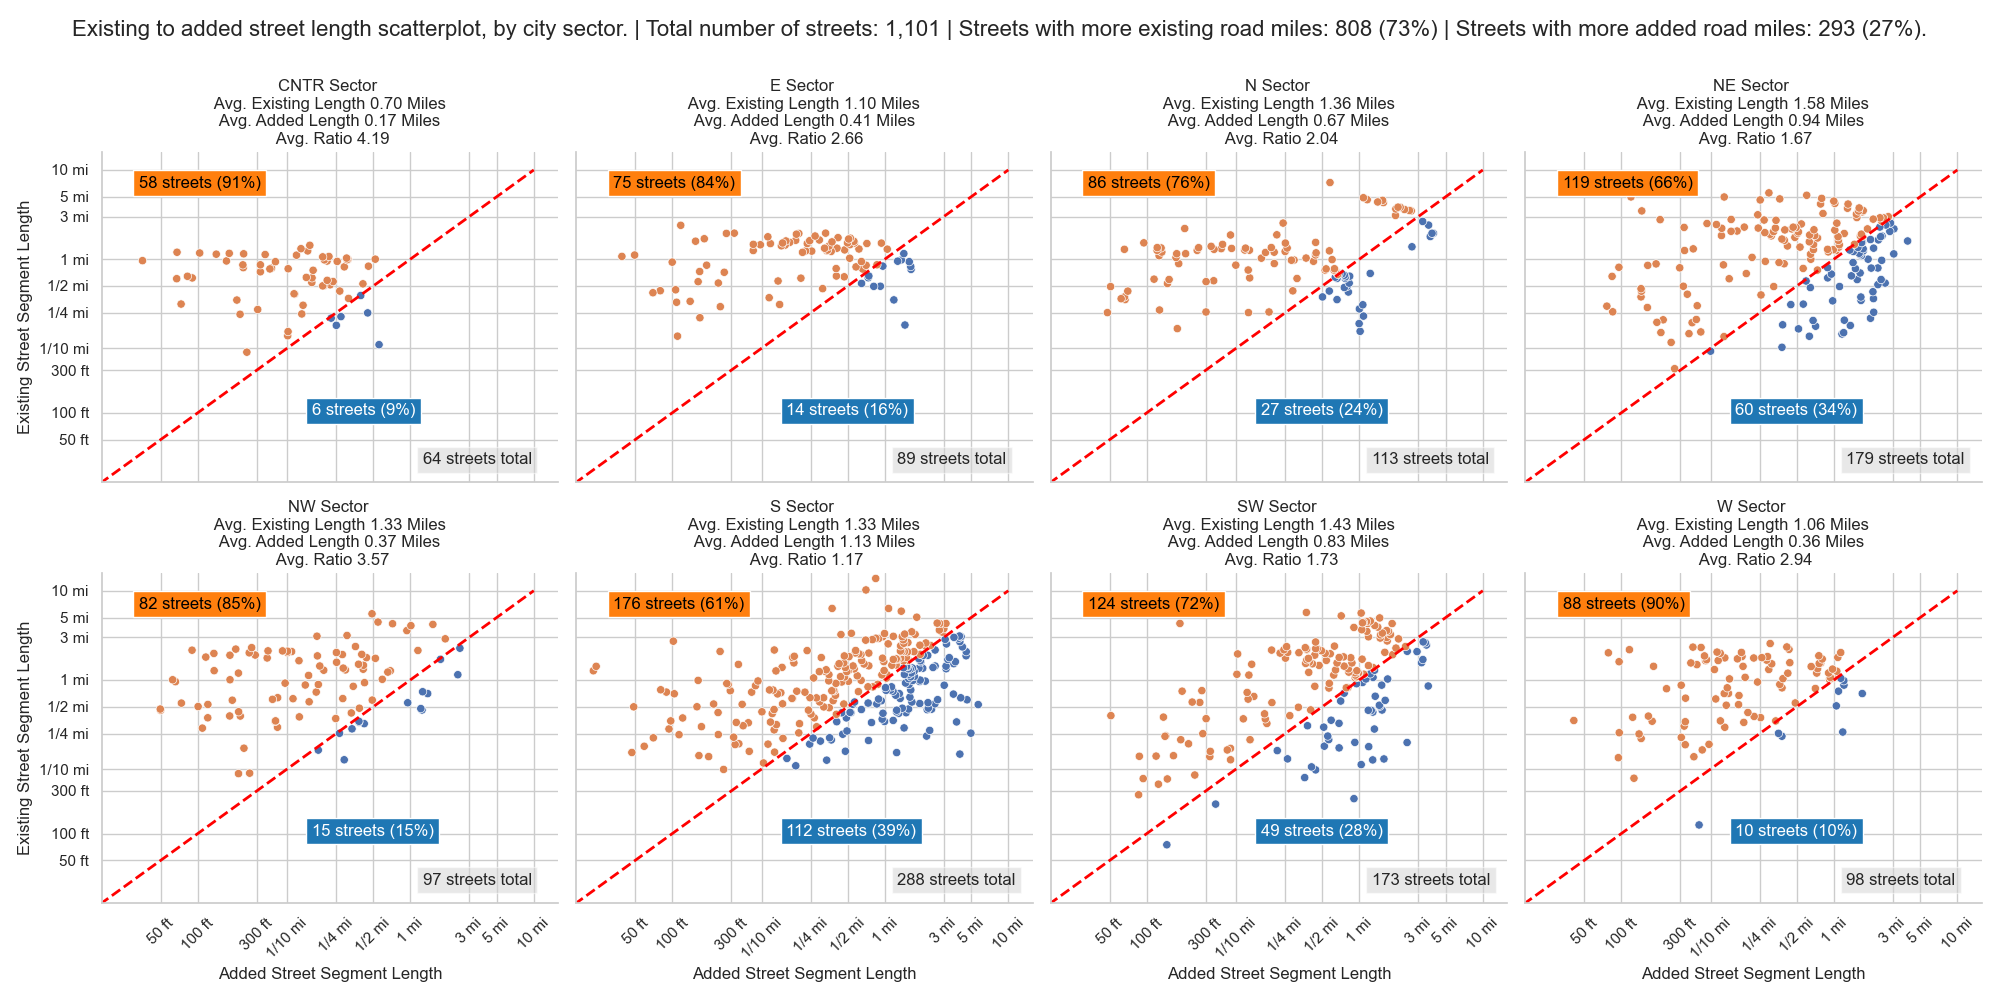
In the image above, the y-axis represents the existing road miles and the x-axis represents the added road miles. Both axes have been log-transformed and are graduated identically; the red line has a slope of 1.0. Orange dots above the red line indicates that a street has more existing road miles and the blue dots below the red line indicate that a street has more added road miles than existing. The individual position of each dot reflects the mapping of the x = added length, y = existing length coordinate pair. The choice of x coordinate and y coordinate was arbitrary. As an example, for 35TH PL NW, there are 0.13 miles of existing of roadway split across two segments. Joining these two segments requires covering a gap of 0.29 miles. Combining the existing and added segments gives a total length of 0.42 miles: 30% of the total road miles is existing road and 70% is added road miles. Computing the ratio of existing length to added length produces a ratio of 0.44. Because this value is less than one, the dot representing 35TH PL NW is colored blue.
In each of the eight sectors, there are more roads with existing road miles than added road miles in Seattle. This makes sense as most of the gaps in the street network are short: across the city, the average gap size is a little less than a quarter of mile and the median gap is approximately 448 feet: just a bit short of one and one-half football fields. In total, there are a little over 1,100 roads in this analysis. Of those roads, 809 (73%) feature more existing road miles while 293 (27%) feature more added road miles. I have prepared tables and maps highlighting the five roads in each sector with the greatest ratio of added road miles to existing road miles. In each of the maps, I have included the rank of each street next to the street name to assist with comparison in the table below.
| City Sector | Street | Added-to-Existing Rank | Existing Miles | Added Miles | Total Miles | Existing Percent | Added Percent | Added-to-Existing Ratio |
|---|---|---|---|---|---|---|---|---|
| CNTR | COMSTOCK ST | 1 | 0.11 | 0.56 | 0.67 | 16.47% | 83.53% | 5.07 |
| CNTR | 39TH AVE | 2 | 0.25 | 0.45 | 0.70 | 35.64% | 64.36% | 1.81 |
| CNTR | TERRACE ST | 3 | 0.18 | 0.25 | 0.43 | 41.90% | 58.10% | 1.39 |
| CNTR | RANDOLPH AVE | 4 | 0.23 | 0.27 | 0.50 | 45.30% | 54.70% | 1.21 |
| CNTR | SMITH ST | 5 | 0.22 | 0.23 | 0.45 | 48.89% | 51.11% | 1.05 |
| City Sector | Street | Added-to-Existing Rank | Existing Miles | Added Miles | Total Miles | Existing Percent | Added Percent | Added-to-Existing Ratio |
| E | E CROCKETT ST | 1 | 0.18 | 1.45 | 1.64 | 11.15% | 88.85% | 7.97 |
| E | E JAMES ST | 2 | 0.35 | 1.18 | 1.53 | 22.80% | 77.20% | 3.39 |
| E | E GARFIELD ST | 3 | 0.77 | 1.63 | 2.40 | 32.02% | 67.98% | 2.12 |
| E | E BLAINE ST | 4 | 0.83 | 1.62 | 2.44 | 33.76% | 66.24% | 1.96 |
| E | 40TH AVE E | 5 | 0.50 | 0.92 | 1.41 | 35.08% | 64.92% | 1.85 |
| City Sector | Street | Added-to-Existing Rank | Existing Miles | Added Miles | Total Miles | Existing Percent | Added Percent | Added-to-Existing Ratio |
| N | N 134TH ST | 1 | 0.16 | 1.01 | 1.17 | 13.28% | 86.72% | 6.53 |
| N | N 132ND ST | 2 | 0.19 | 0.99 | 1.18 | 15.98% | 84.02% | 5.26 |
| N | N 136TH ST | 3 | 0.23 | 1.08 | 1.31 | 17.56% | 82.44% | 4.70 |
| N | N 56TH ST | 4 | 0.28 | 1.00 | 1.28 | 21.68% | 78.32% | 3.61 |
| N | N 58TH ST | 5 | 0.31 | 1.07 | 1.37 | 22.40% | 77.60% | 3.46 |
| City Sector | Street | Added-to-Existing Rank | Existing Miles | Added Miles | Total Miles | Existing Percent | Added Percent | Added-to-Existing Ratio |
| NE | 41ST PL NE | 1 | 0.22 | 1.98 | 2.20 | 9.89% | 90.11% | 9.11 |
| NE | NE 67TH ST | 2 | 0.25 | 2.10 | 2.35 | 10.77% | 89.23% | 8.29 |
| NE | NE 138TH ST | 3 | 0.14 | 1.16 | 1.31 | 11.07% | 88.93% | 8.03 |
| NE | 44TH PL NE | 4 | 0.15 | 1.20 | 1.35 | 11.11% | 88.89% | 8.00 |
| NE | NE 48TH ST | 5 | 0.18 | 1.36 | 1.54 | 11.73% | 88.27% | 7.53 |
| City Sector | Street | Added-to-Existing Rank | Existing Miles | Added Miles | Total Miles | Existing Percent | Added Percent | Added-to-Existing Ratio |
| NW | NW 89TH ST | 1 | 0.46 | 1.24 | 1.70 | 27.01% | 72.99% | 2.70 |
| NW | NW 88TH ST | 2 | 0.48 | 1.21 | 1.69 | 28.19% | 71.81% | 2.55 |
| NW | 35TH PL NW | 3 | 0.13 | 0.29 | 0.42 | 30.41% | 69.59% | 2.29 |
| NW | 5TH AVE NW | 4 | 1.14 | 2.42 | 3.57 | 32.05% | 67.95% | 2.12 |
| NW | NW 72ND ST | 5 | 0.70 | 1.38 | 2.08 | 33.70% | 66.30% | 1.97 |
| City Sector | Street | Added-to-Existing Rank | Existing Miles | Added Miles | Total Miles | Existing Percent | Added Percent | Added-to-Existing Ratio |
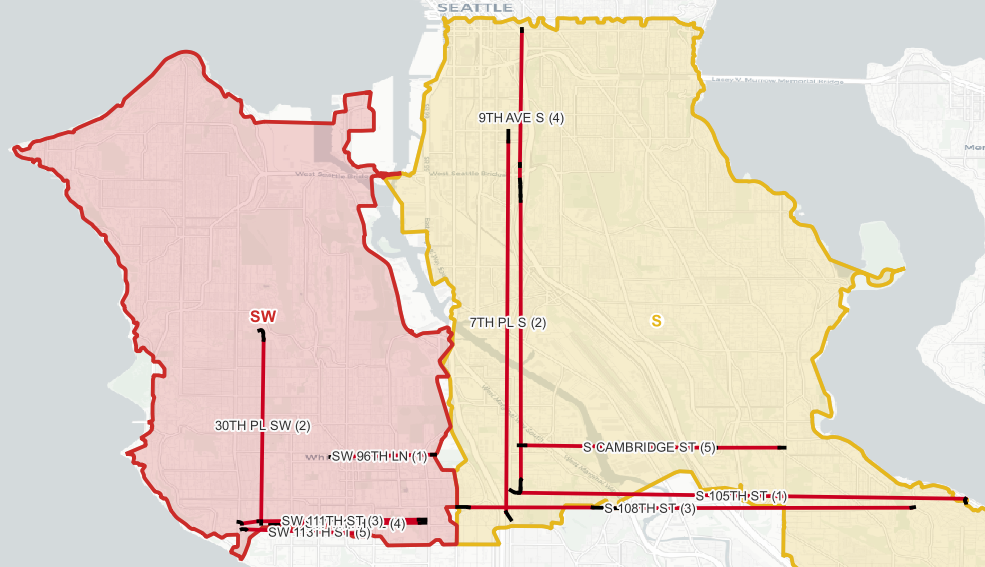
| S | S 105TH ST | 1 | 0.15 | 4.05 | 4.20 | 3.51% | 96.49% | 27.51 |
| S | 7TH PL S | 2 | 0.25 | 4.97 | 5.23 | 4.84% | 95.16% | 19.68 |
| S | S 108TH ST | 3 | 0.34 | 3.81 | 4.15 | 8.15% | 91.85% | 11.27 |
| S | 9TH AVE S | 4 | 0.53 | 5.70 | 6.23 | 8.48% | 91.52% | 10.80 |
| S | S CAMBRIDGE ST | 5 | 0.23 | 2.18 | 2.41 | 9.72% | 90.28% | 9.29 |
| City Sector | Street | Added-to-Existing Rank | Existing Miles | Added Miles | Total Miles | Existing Percent | Added Percent | Added-to-Existing Ratio |
| SW | SW 96TH LN | 1 | 0.05 | 0.90 | 0.95 | 4.91% | 95.09% | 19.39 |
| SW | 30TH PL SW | 2 | 0.20 | 2.43 | 2.63 | 7.54% | 92.46% | 12.27 |
| SW | SW 111TH ST | 3 | 0.13 | 1.58 | 1.71 | 7.59% | 92.41% | 12.17 |
| SW | SW 111TH PL | 4 | 0.13 | 1.28 | 1.41 | 9.00% | 91.00% | 10.11 |
| SW | SW 113TH ST | 5 | 0.11 | 1.03 | 1.15 | 9.80% | 90.20% | 9.20 |
| City Sector | Street | Added-to-Existing Rank | Existing Miles | Added Miles | Total Miles | Existing Percent | Added Percent | Added-to-Existing Ratio |
| W | 45TH AVE W | 1 | 0.26 | 1.18 | 1.44 | 18.08% | 81.92% | 4.53 |
| W | W SEMPLE ST | 2 | 0.02 | 0.08 | 0.10 | 22.65% | 77.35% | 3.42 |
| W | W FULTON ST | 3 | 0.70 | 1.70 | 2.40 | 29.29% | 70.71% | 2.41 |
| W | W WHEELER ST | 4 | 0.51 | 1.05 | 1.56 | 32.84% | 67.16% | 2.04 |
| W | W TILDEN ST | 5 | 0.23 | 0.38 | 0.61 | 38.14% | 61.86% | 1.62 |
The top 5 streets in the Northwest, North, and Northeast Sectors:
The top 5 streets in the West, Center, and East Sectors:
The top 5 streets in the Southwest and South Sectors:
Future work
I’m wrapping up this examination of the ratio of added streets to existing streets. However, while I was working on this task, I wondered if there was a way to verify that the missing segments I created were not recreations of existing streets. It turns out I can! I’ll save that for another post.