Let’s create a treemap from a Microsoft Word document! While writing my dissertation, I wondered if I could visualize the progress I was making. I wanted something more than page counts. Effectively, I wanted a way to show how my manuscript grew and changed the more I wrote and edited. It turns out I was able to do that using a combination of python and R!
Background
I’ve created a github repo featuring code that uses the python-docx python library to extract character counts by document section from a Microsoft Word Document and the treemap R library to visualize the relative sizes of each section.
The genesis of this project was wanting to see progress. Writing is hard. It’s time consuming and goes in fits and starts. With respect to my dissertation, some days I would write pages of text and some days I would only write a paragraph. On those days I wrote a lot I wanted to see how I changed the document. Invariably, with writing comes editing. Text is moved, discarded, expunged, reincorporated, and reformed. Leaning into that process helped me keep writing, certainly. But that wasn’t always the case. I wanted to see progress and change. Could I visualize those changes? Could I track those changes over time? Yes, I could track page counts and word counts, but I wanted something more. For example, while I was using Pacemaker to track progress via word counts, I wanted something more splashy. I quickly settled on a treemap visualization due to the hierarchical nature of text nested within headings and subheadings. So I set about procrasti-working on a side task. Before any visualization, I made sure my headings were properly identified and other text was appropriately styled. (I am a big proponent of using headings and styles in Word as they help tremendously with document navigation and editing.) I used python-docx to extract and format the word count data. I then used the treemap R library to make the graphic because the process is easier in R and R makes better visualizations.
As an example of a treemap showing document change over time, here is a treemap from when I was about a year out from completing my dissertation:
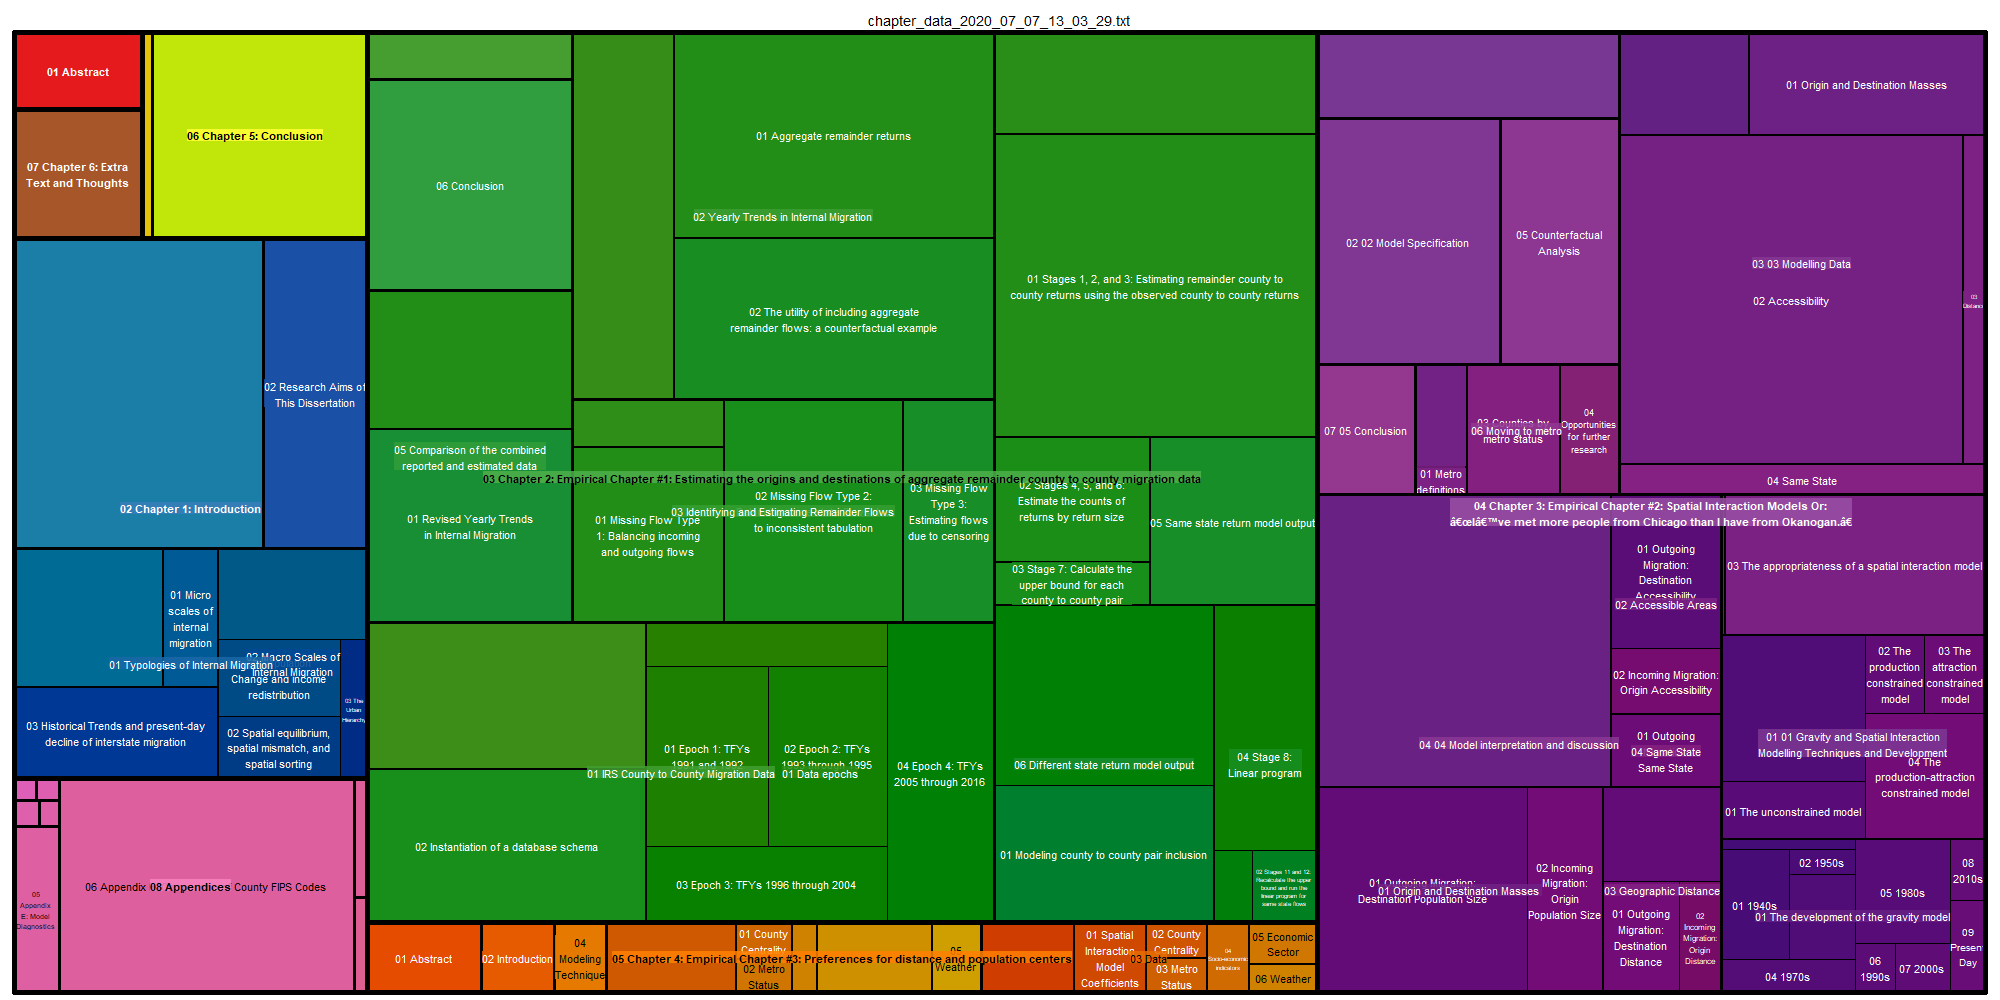
That is from July of 2020. Since then I’ve updated the visualization routine to better differentiate chapter headings.
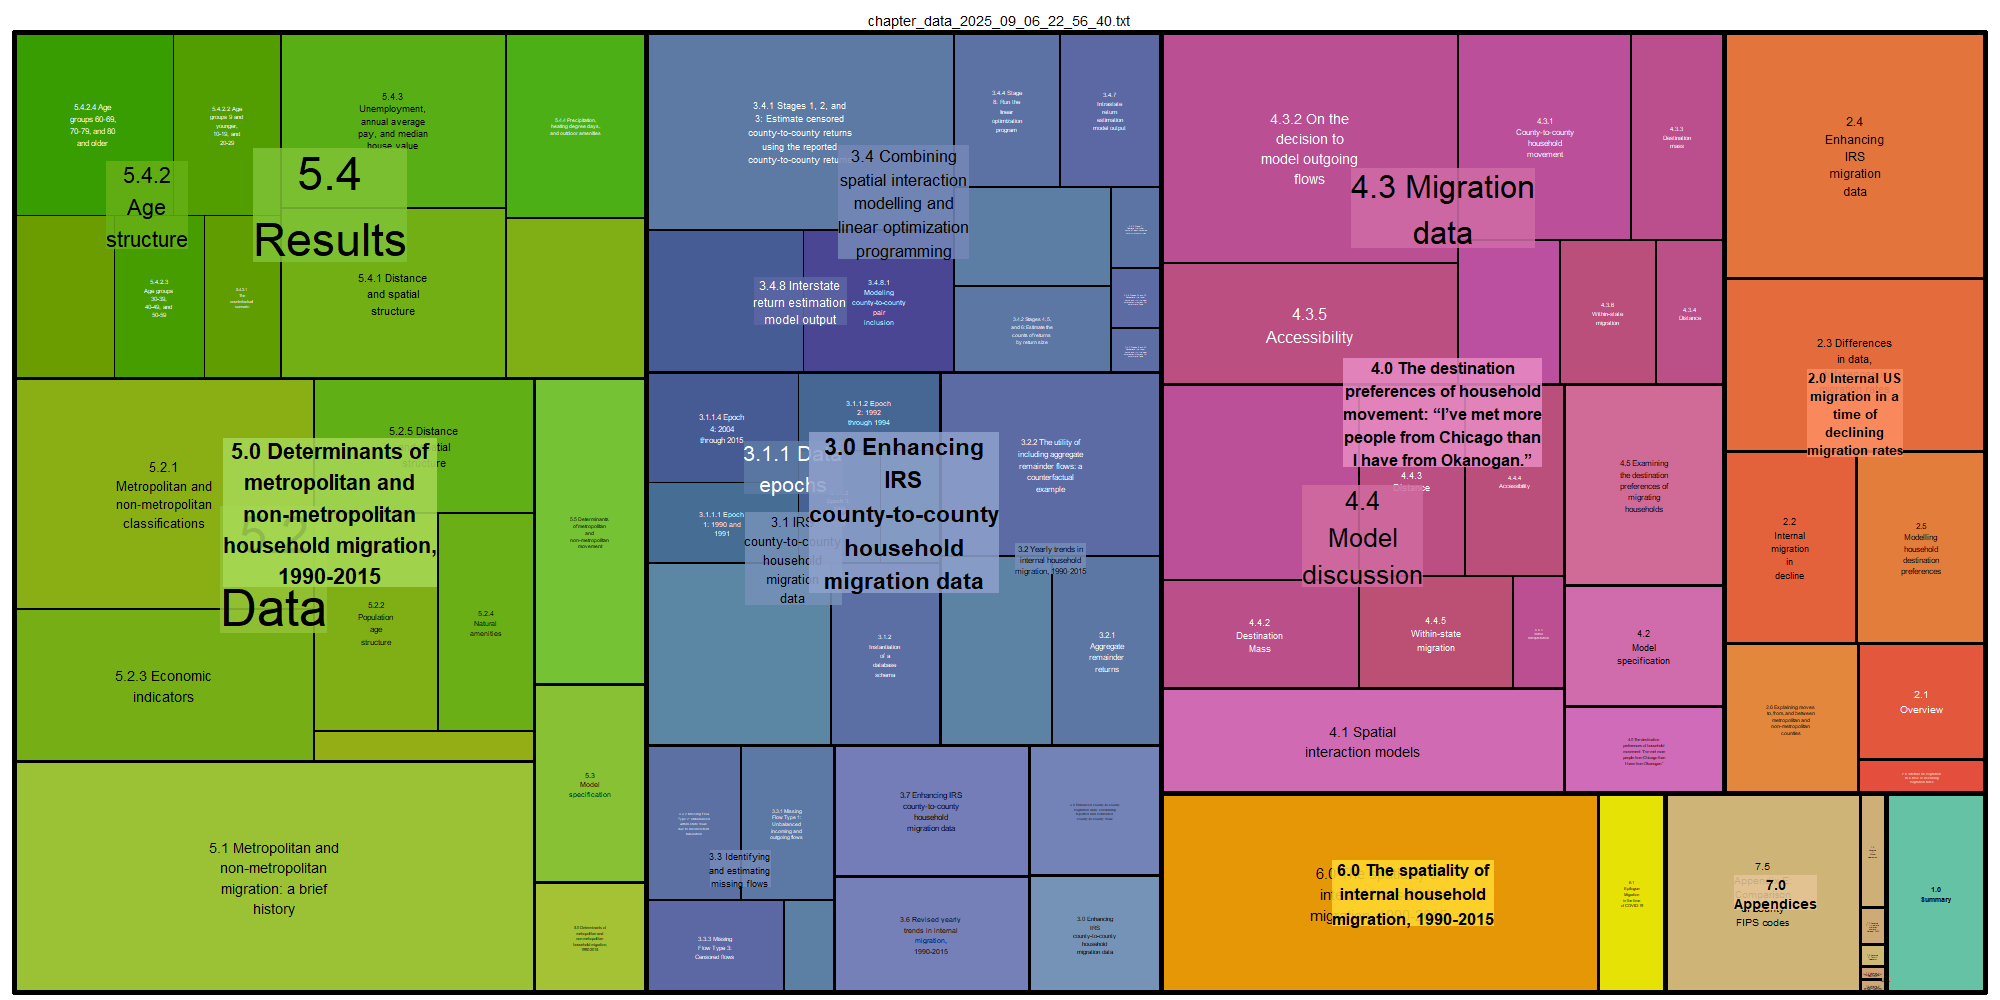
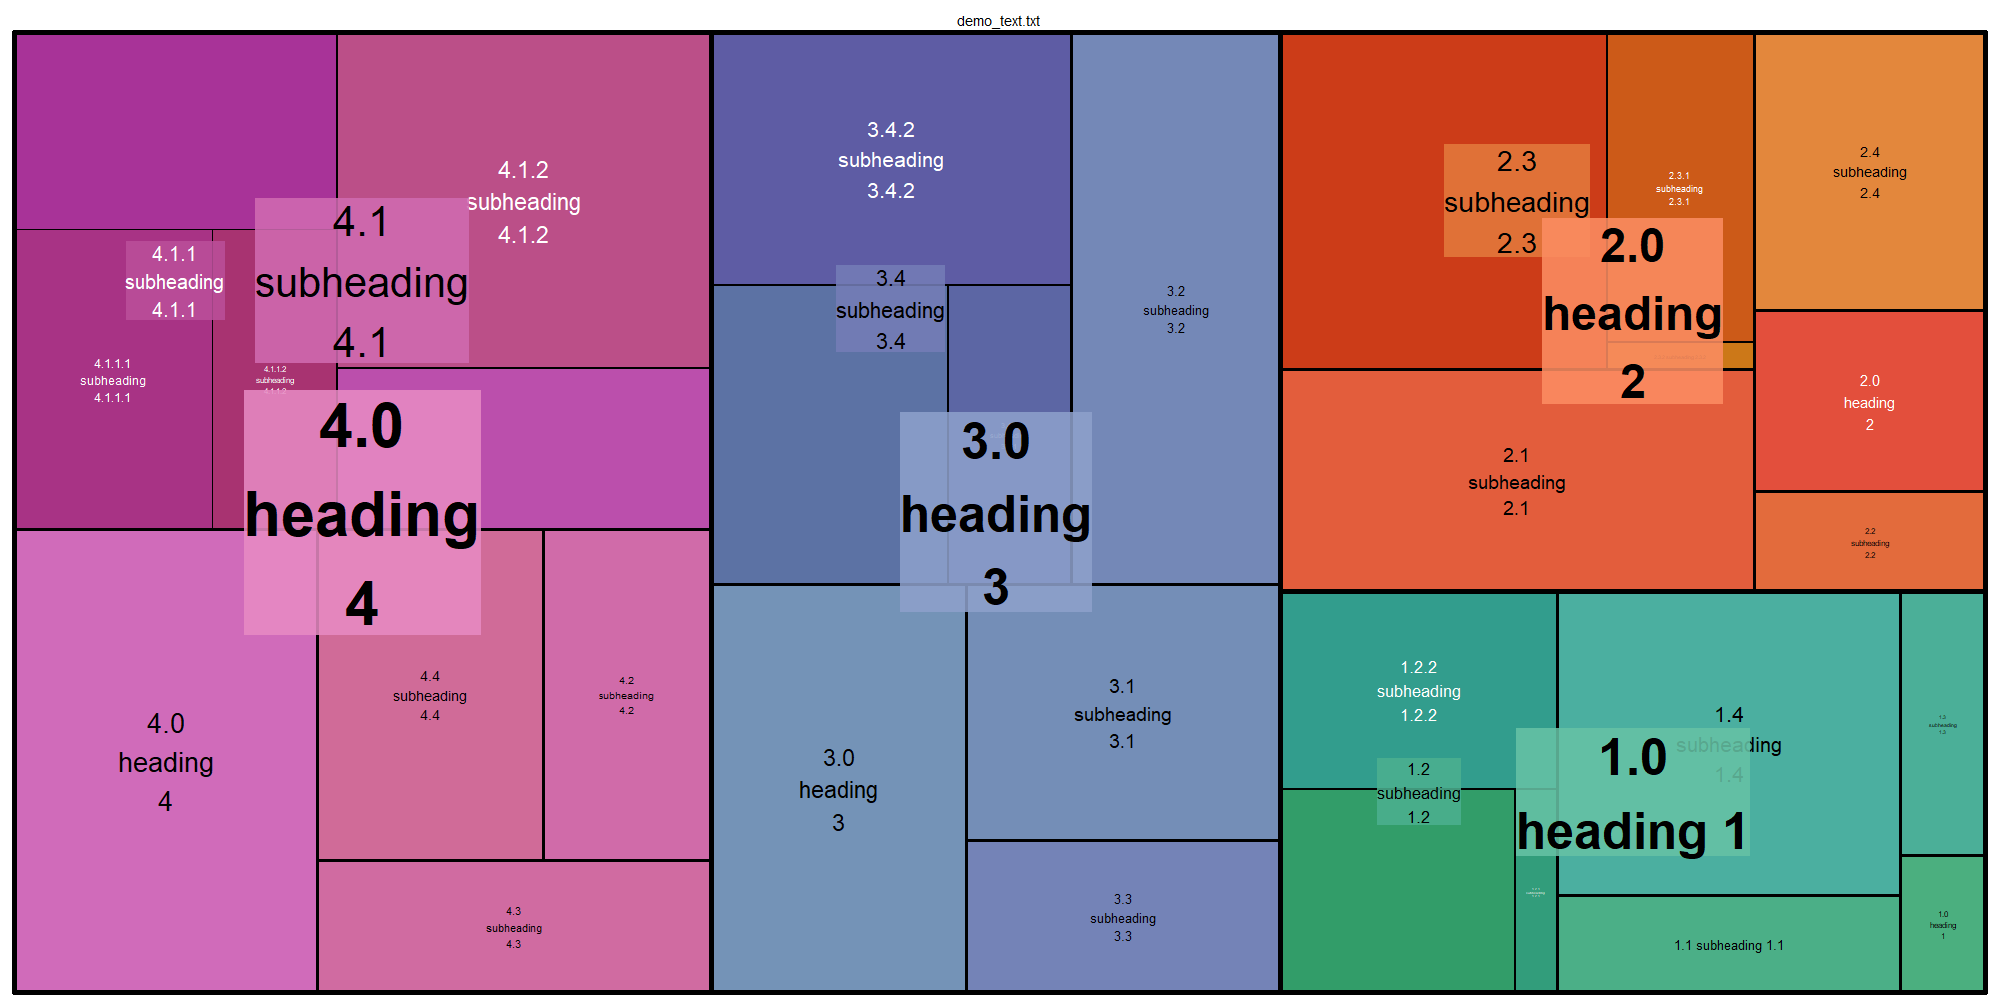
In the repo linked to above, I include functionality creating a Word document featuring lorem ipsum text generated using the python-lorem package under manually created headings. The resulting treemap can be seen below:
Future work and conclusion
I wrote my dissertation in Word. The as-submitted document was written in LaTex. The final Word document and the as-submitted LaTex document are more or less the same, barring some minor edits. I mention this because as of right now, creating a treemap from a document is only possible from a Word document. In the future, I could see a LaTex plugin/library that creates a treemap. (How cool would it be if a treemap is created every time the document is compiled?!) I could also see extending the functionality of the existing script to scan a Markdown document and build a treemap.
Finally, I like to think of a treemap of a document as a visual representation of the document’s table of contents. A treemap from a document shows relative sizes of a document’s sections and does not assist with the research described in the document. Did it help me with writing? Yes, in that it helped me see the progress I was making and helped with motivation. But, it didn’t help me with any of the research and analyses I undertook. However, in future projects I can see how a treemap could be used to identify overly-verbose or under represented sections of a document and in turn help sharpen exposition.
Happy treemapping!